- Analítica
- Análise Técnica
Índice de ações australiano Análise técnica - Índice de ações australiano Negociação: 2024-11-28
ĺndice da bolsa australiana Resumo da Análise Técnica
acima de 8486.36
Buy Stop
abaixo de 8387.21
Stop Loss
| Indicador | Sinal |
| RSI | Neutro |
| MACD | Comprar |
| Donchian Channel | Comprar |
| MA(200) | Comprar |
| Fractals | Comprar |
| Parabolic SAR | Comprar |
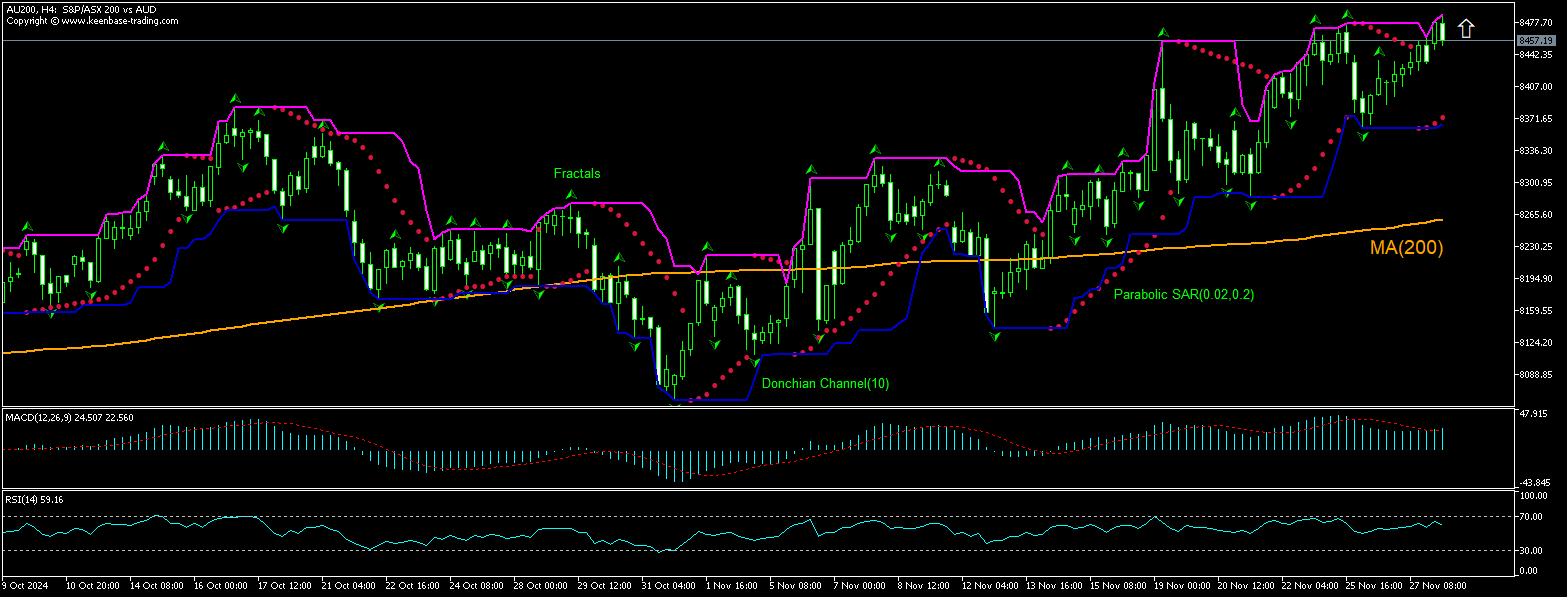
ĺndice da bolsa australiana Análise gráfica
ĺndice da bolsa australiana Análise Técnica
The AU200 technical analysis of the price chart on 4-hour timeframe shows AU200,H4 is rebounding above the 200-period moving average MA(200) after pullback following a record close three days ago. We believe the bullish momentum will continue after the price breaches above the upper Donchian boundary at 8486.36. This level can be used as an entry point for placing a pending order to buy. The stop loss can be placed below 8387.21. After placing the pending order the stop loss is to be moved every day to the next fractal low indicator, following Parabolic signals. Thus, we are changing the expected profit/loss ratio to the breakeven point. If the price meets the stop-loss level (8387.21) without reaching the order (8486.36) we recommend cancelling the order: the market sustains internal changes which were not taken into account.
Análise Fundamental de Índices - ĺndice da bolsa australiana
Australia’s business capital expenditures rose in third quarter. Will the AU200 price advancing continue?
Australia’s private capital expenditure data released today were stronger than expected: Australian Bureau of Statistics reported new capital expenditure by private businesses increased by 1.1% over quarter in Q3, rebounding from a 2.2% decline in Q2 while an 0.9% rise was expected. On an industry basis, capital expenditure on buildings and structures and for manufacturing led the rebound as they increased by 27.2% and 17% respectively, partly offsetting a fall in mining industry spending on buildings and structures, which was down 2.5%. Rebounding capital expenditures by Australian private businesses is bullish for Australian gross domestic product and hence the AU200 stock index.
Nota de rodapé:
Esta visão geral é apenas para fins informativos e educacionais, e é publicada de forma gratuita. Todos os dados contidos neste documento são obtidos de fontes públicas que são consideradas mais ou menos confiáveis. Ao mesmo tempo, não há garantias de que as informações são completas e precisas. No futuro, as visões separadas não são atualizadas. Todas as informações em cada visão geral, incluindo opiniões, índices, gráficos etc., são apresentadas apenas para fins informativos e não são aconselhamentos financeiros ou recomendações. Todo o texto e qualquer parte dele, assim como os gráficos não podem ser considerados como uma oferta para realizar quaisquer transações com qualquer ativo. A empresa IFC Markets e seus funcionários sob nenhumas circunstâncias não são responsáveis por quaisquer acções, realizados por uma pessoa durante ou depois de ler a visão geral.


